Tree diagrams are a great way to organize and visualize information. Mulquatro is not just a software for creating mind maps, it is also a tree diagram maker that will help you create the coolest diagrams within minutes. Take advantage of its vast collection of diagram templates to jumpstart your maps and decisions trees. Just customize the fonts, colors, and content until your diagram looks exactly how you want it to.
What is a tree diagram and what to use it for?
A tree diagram is a visual tool used to break down complex problems or processes into smaller, connected parts, making it easier to understand relationships, decisions, or hierarchies. Depending on the context, it can be a graphical representation of potential outcomes and their relationships.
Most popular use cases:
- Decision-Making: visualizing different possible outcomes based on various decisions or actions, making it easier to choose the best course of action.
- Problem Solving: breaking down complex problems into smaller, manageable parts, and analyzing possible solutions and consequences.
- Risk Analysis: evaluating potential risks and their impacts, helping to assess the likelihood of different scenarios and their effects.
- Process Mapping: visualizing and optimizing processes, while identifying potential bottlenecks or inefficiencies.
- Business Strategy: mapping out strategies, and exploring potential market moves.
- Machine Learning & AI: in data science, decision trees are used as models for classification and regression tasks, helping to predict outcomes based on historical data.
- Project Planning: assessing project tasks and milestones.
- Risk Management: identifying and assessing risks and uncertainties, enabling proactive risk mitigation strategies.
- Customer Journey Mapping: mapping out different decision paths a customer might take during their journey.
Types of tree diagrams:
Here are some of the most common types of tree diagrams, each serving a different purpose:
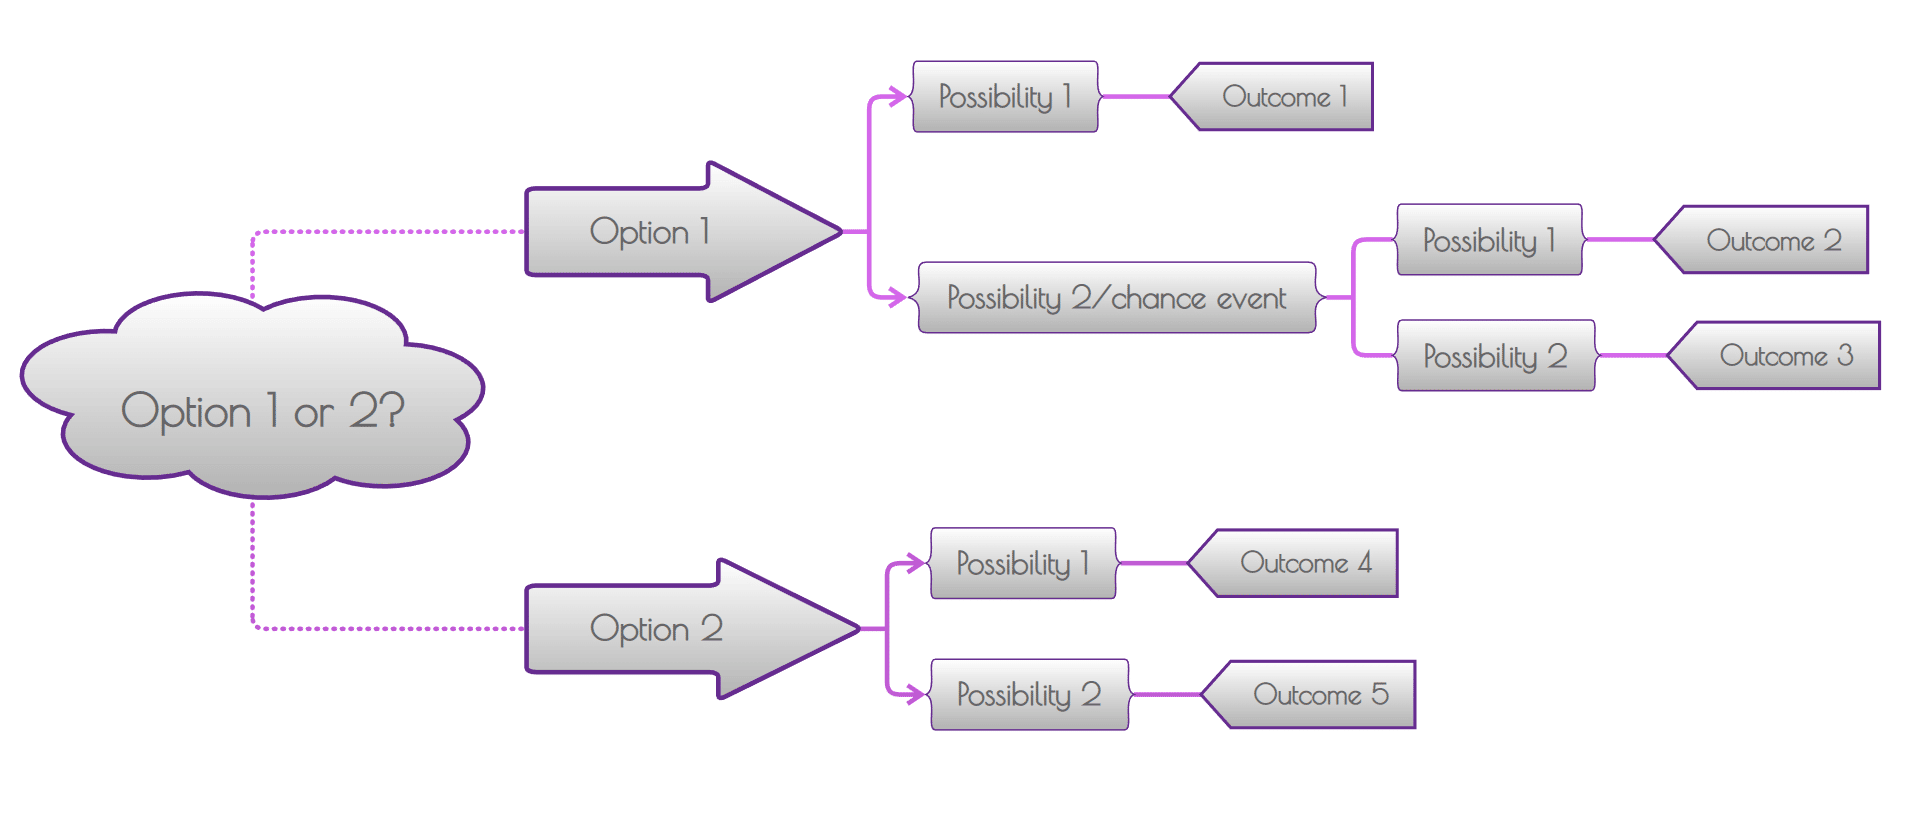
- Decision Tree: it helps in decision-making, each branch represents a choice, and the leaves represent possible outcomes or results.
- Probability Tree: it focuses on the probability of various events occurring. It’s often used in statistics to calculate the likelihood of different outcomes based on prior probabilities.
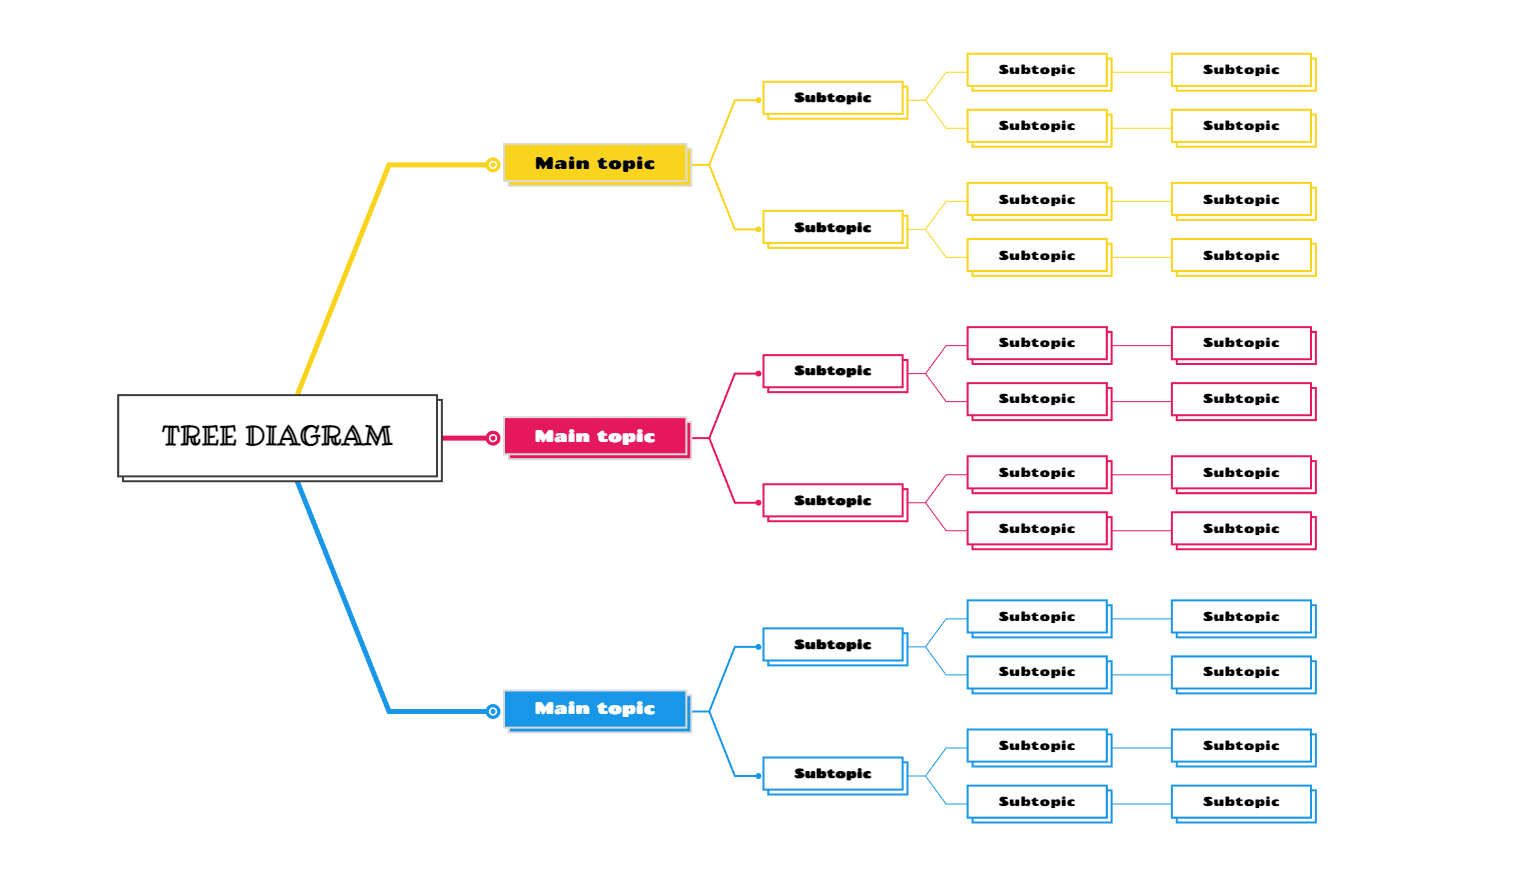
- Hierarchical Tree Diagram: it represents a hierarchy or structure, showing relationships between a main item and its subcategories or components. Commonly used in organizational charts and family trees.
- Classification Tree: used in machine learning for classifying data. It splits data into branches based on specific features.
- Phylogenetic Tree: used in biology to show the evolutionary relationships between different species. Each branch represents a common ancestor, and the leaves represent species or groups.
- Genealogical Tree: also known as a family tree, it shows family relationships and ancestry, illustrating the lineage of individuals over multiple generations.
- Tree of Knowledge: often used in education, it maps out concepts and how they relate to one another. Each branch represents a different category or topic.
- Flow Tree Diagram: Used to show the sequence of actions or steps in a process, commonly applied in process management or system design.
How to make a tree diagram online
- Choose a diagram maker. There are many different diagram makers available online, yet Mulquatro is one of the most popular diagramming tools.
- Select a tree diagram template. Most tools have a variety of tree diagram templates, choose the ones that best suit your needs.
- Add your content. You can add text, images, and other media. Add text, images and other media, formulas, and data layers, to build the desired framework.
- Adjust styling and formatting. Make sure you do any last minute customizations, if needed.
- Share, export, and present your diagram. Share your work with personalized permissions to control editing access, Many diagram makers allow you to export your diagrams as images or PDFs. Mulquatro also enables you to make tree diagrams online, then turn them into lively presentations with just a couple of clicks.
If you’re looking for a fast and easy way to create tree diagrams, then Mulquatro is the perfect tool for you. Besides making tree diagrams, you can find many concept map and mind map templates , and you can create timelines, outlines, and Gantt charts.
10 Tips for the most effective tree diagrams
Follow these tips to create clear, organized, and effective tree diagrams:
- Keep it simple: don’t overload the diagram with too many branches or details. Focus on essential information, and keep the structure clean and easy to follow.
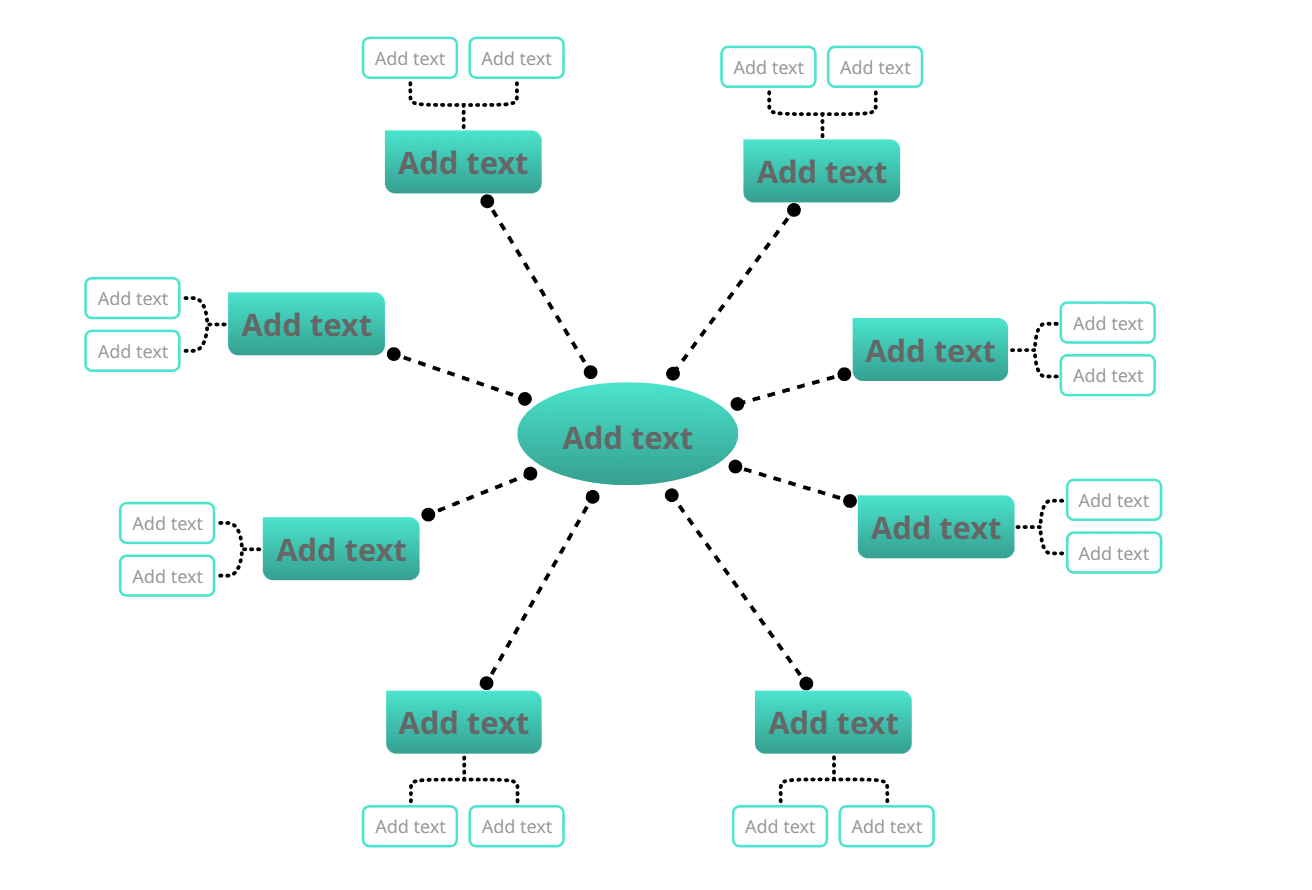
- Start with a clear idea: your main idea or decision should be at the top or center. This will set a clear foundation for the branches to develop further.
- Use clear labels: label each branch with concise and meaningful descriptions. This makes the diagram easy to understand and navigate.
- Limit the number of levels: too many levels will make the diagram look cluttered and overwhelming.
- Use colors for clarity: color code branches or levels to visually separate different categories, stages, or decision paths. This improves readability and helps identify patterns or relationships.
- Ensure consistent spacing: equal spacing between branches and levels will keep the diagram visually balanced and easier to interpret.
- Be logical within the structure: all branches must follow a logical flow. Each decision or outcome should logically lead to the next step, and branches should not cross to avoid confusion.
- Use visual hierarchy: create a clear visual hierarchy by making the main idea larger or more prominent, and using smaller branches for subcategories.
- Consider your audience: if needed, tailor your tree diagram to the needs of the people who will be viewing it. Use appropriate terminology as well.
- Review for accuracy: Double-check the content and structure to ensure there are no errors. Mistakes lead to confusion and reduce the effectiveness of your diagram.
FAQs
1. What is a decision tree’s purpose?
A decision tree is specifically designed to help in any decision-making process. Use it whenever you want to represent decisions, their possible consequences, risks, and rewards in a structured way. It’s a type of flowchart that maps out choices and their potential outcomes.
2. What do a decision tree’s shapes mean?
The diagram has three types of nodes: chance nodes, decision nodes, and end nodes. Depicted as a circle, a chance node represents the probabilities of various outcomes. Shown as a square, a decision node indicates a point where a decision must be made. An end node, represented by a triangle, marks the final outcome of a particular decision path.
3. Any differences between a decision tree and a flowchart?
Decision trees are designed to focus on a single decision or classification. In contrast, flowcharts are used to outline the tasks within a process, which may involve multiple decisions at different stages.
Sign up on Mulquatro today and start creating your tree diagrams!
Keep it smart, simple, and creative!
The Mulquatro Team